Personal › Budget
See where the money
actually went.
Set a limit per category, log what you spent, and the app shows you the truth: how much is left, where it’s leaking, and whether this month is on track. No bank login to hand over, no spreadsheet to maintain — just a clear picture you can act on in a minute a day. Free to start; cloud sync & ad-free from $5/mo.
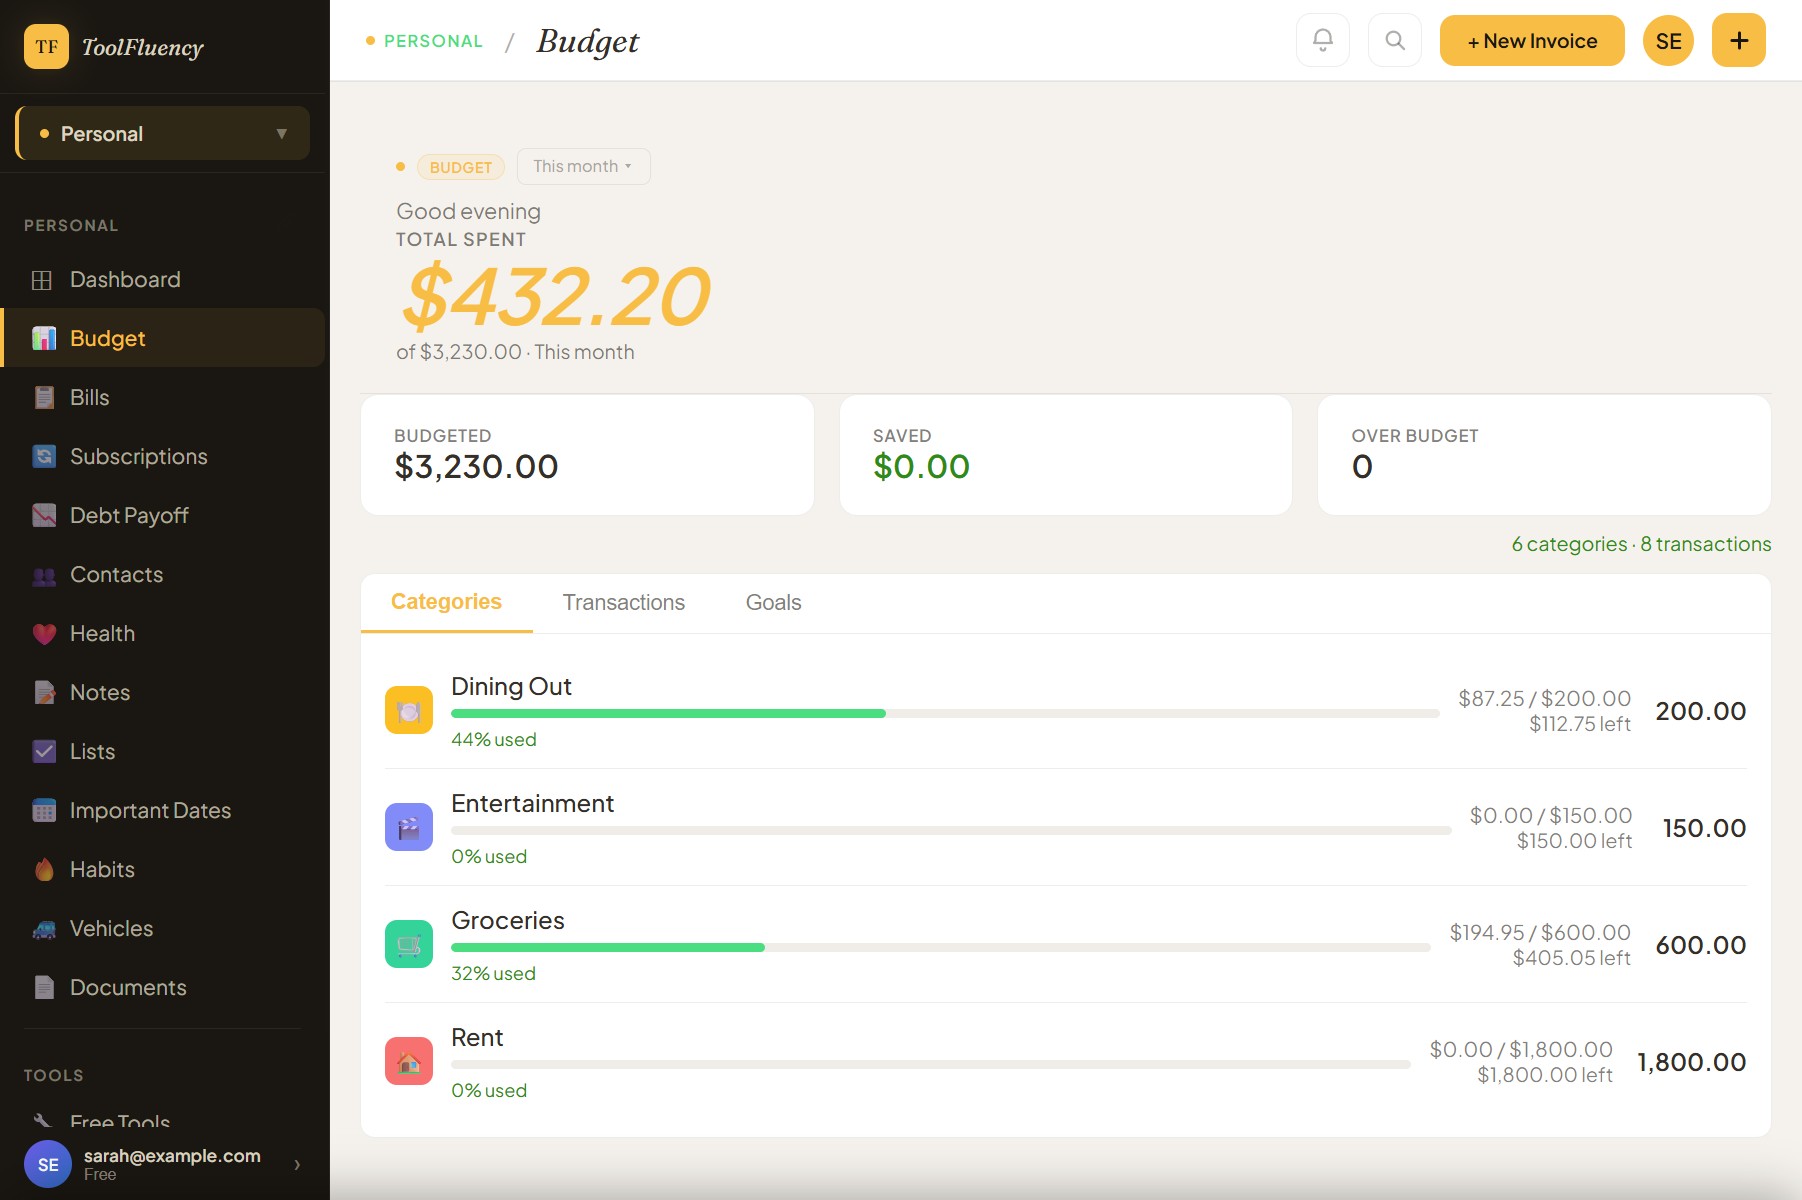 Income vs. spending, by category
- No bank connection — by design
- Your categories, your rules
- Works on any phone or browser
- No credit card to start
How it works
1
Set your category limits
Pick from 24 built-in presets (Groceries, Rent, Coffee, Gas…) or build your own. Set a monthly — or weekly, biweekly, or daily — limit for each one. Takes about three minutes to set up.
2
Log what you spent
Add each transaction in a few taps: date, amount, merchant, category. Income entries go in the same place — paycheque, freelance payment, whatever comes in. There’s no auto-import; you’re aware of every dollar.
3
See where it’s leaking
Every category shows a progress bar: green means you’re under, amber means you’re close, red means you’re over. Income versus spending is right at the top. The problem categories announce themselves — you don’t have to hunt.
What it does
Every budget job handled, end to end
From the category you set on Sunday to the transaction you log at the store on Thursday — these are the flows that keep your money picture honest all month.
Spending progress bar per category
Every category you create gets its own live progress bar: spent vs. your limit, percentage used, and exactly how much is left. The bar turns amber when you hit 80% and red when you’re over. You see the whole picture at a glance — 18 categories on one screen, no scrolling to find the problem. You can also edit the monthly limit inline, right on the category row, without opening a drawer.
Income and expense in the same log
Transactions are typed: expense or income. Log your paycheque, a freelance payment, or a tax return as income; log groceries, gas, or a dinner out as expenses. The hero shows income, total spent, and what’s left — the number that actually tells you where you stand.
Daily, weekly, bi-weekly, or monthly limits
Rent is monthly; groceries might make more sense weekly; your daily coffee habit can track daily. Each category carries its own cadence. The totals on the hero scale to match whichever period you’re viewing — so "this month" vs. "this year" comparisons always add up correctly.
Savings goals with progress tracking
Set a goal name, target amount, and optional deadline. Record how much you’ve saved toward it over time — the goal card shows a progress bar and percentage complete. Goals for a down payment, a trip, or a renovation each get their own card. The hero surfaces total saved across all goals.
Manual entry — your bank login stays with your bank
ToolFluency doesn’t connect to your bank, and that’s intentional. Bank-connecting apps require you to hand your credentials to a third-party aggregator (Plaid, Flinks). We’d rather not ask you to do that. You log entries manually — it takes a few minutes a week, and the upside is your banking data never leaves your bank.
CSV export — your data, yours to keep
Export your full transaction log any time: date, merchant, category, note, and amount. Open it in Excel, Google Sheets, or hand it to your accountant. Your data is never locked in. If you ever move on, you walk away with everything intact.
Subcategories and transaction search
Group related categories under a parent — "Food" can have "Groceries," "Dining Out," and "Coffee" underneath it. The parent row rolls up subcategory spending so you can see both the total and the breakdown. The transaction tab has live search and category filter chips so finding a specific purchase takes two taps.
FAQ
Budget questions answered
Does it connect to my bank or import transactions automatically?
No — and that’s a deliberate choice. Bank-connected apps route your credentials through a third-party aggregator (Plaid, Flinks, Yodlee) so the app can read your transaction history. That’s a meaningful trust transaction we don’t want to ask you to make. Entries in ToolFluency Budget are logged manually — or you can paste from a bank statement if you prefer batch entry. The trade-off is a few minutes of entry per week. The upside is your bank login never leaves your bank, and there’s no aggregator holding a copy of your spending history.
Is the budget tracker free, or do I need Personal Plus?
The core budget tracker — categories, transactions, savings goals, spending progress bars — is free. You can use it with no account on a single device. Create a free account and it saves across sessions on that device. Personal Plus ($5 CAD/mo) adds cloud sync so your budget follows you across your phone, tablet, and laptop, removes all ads, and unlocks document storage and photo albums. The budget itself is the same in both tiers.
How do I set up spending categories?
The category modal walks you through it. There are 24 built-in presets grouped by type — Essentials (Rent, Utilities, Phone & Internet, Insurance), Daily Life (Groceries, Coffee, Dining Out, Gas, Transit), Lifestyle (Subscriptions, Entertainment, Shopping, Travel, Hobbies, Clothing, Personal Care), Wellbeing (Health & Fitness, Medical, Pets, Childcare, Education), and Other (Gifts, Donations, Miscellaneous). Pick any preset to pre-fill the name, icon, suggested amount, and cadence — then adjust to your actual numbers. Or start blank and build your own. You can create subcategories to group related spending under one parent.
Can I set a weekly or daily budget — not just monthly?
Yes. Each category has its own cadence: daily, weekly, bi-weekly, or monthly. A Coffee category makes more sense at $5/day than $150/month. Groceries might track better at $150/week. The spending totals in the hero scale to match whichever period you’re currently viewing, so a weekly category and a monthly category show up side by side without confusion.
Does it work on my phone?
Yes — the whole app is built mobile-first and works in any iOS or Android browser without downloading anything. The transaction entry modal is designed for one-handed use: amount and date on the same row, category chips you tap rather than type. Add ToolFluency to your home screen and it behaves like an installed app, including working through patchy connections (it’s a Progressive Web App).
Can I export my transactions?
Yes, any time. The Transactions tab has an Export button that downloads a CSV with date, merchant, category, note, and amount for every transaction in your log. Open it in Excel, Google Sheets, or Numbers. If you ever decide ToolFluency isn’t for you, your data leaves with you — we don’t hold it hostage.
Does it force me into a specific budgeting method like zero-based or the 50/30/20 rule?
No methodology lock-in. You decide your categories, you decide your limits, you decide how you use the data. If you want to build a zero-based budget, the tools are there. If you just want to know which category is blowing up your month, it tells you that without asking you to subscribe to a philosophy. The app is descriptive, not prescriptive — it shows you what happened, you decide what to change.
Also in Personal
Budget is just the start
The budget page gives you the category-by-category picture. These sibling tools handle the recurring charges, the debt math, and the documents that sit alongside your monthly spending.
Related: Debt Payoff
The exact month you’ll be debt-free.
Avalanche or snowball method — whichever suits you. Enter your balances, rates, and minimum payments and the planner shows you the payoff date at your current pace, plus how much sooner you’ll finish if you add an extra $50 or $200 a month. Honest math, no upsell.
Related: Subscriptions
Find the charges you forgot you signed up for.
List every subscription — streaming, cloud storage, gym, apps, meal kits. See the total monthly and annual cost in one view. Most people find $30–$80/mo of subscriptions they can cancel immediately. Knowing is the first step; the tracker makes the audit take ten minutes.
Related: Documents
The “where did I save the…” panic stops.
Insurance policies, vehicle titles, warranty PDFs, lease agreements, kids’ health records. With Personal Plus you get encrypted document storage — searchable, private, and on your phone when you need it at the dealership or the doctor’s office.